Global investors seeking a perceived safe haven piled into gold-backed ETFs in 2019, making it the best year on record for gold holdings. Assets under management (AUM) in gold bullion ETFs expanded 37 percent from the previous year, adding $19.2 billion, or 400 tonnes, according to the World Gold Council (WGC). During the fourth quarter, total holdings hit a jaw-dropping 2,900 tonnes, the equivalent of 102 million ounces, which is the most on record.
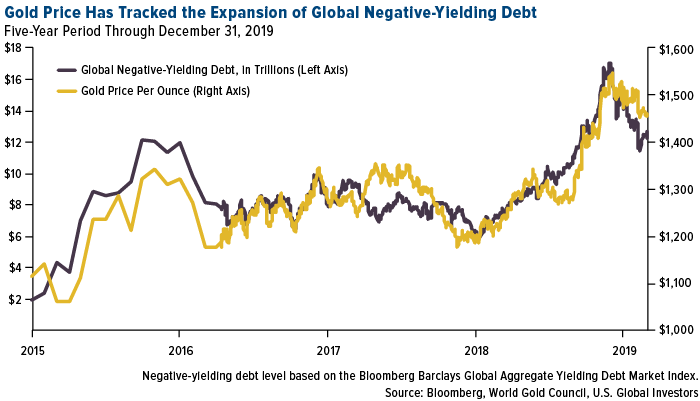
Physical gold, meanwhile, had its best year since 2010, climbing as much as 18.31 percent. The yellow metal’s role as an exceptional store of value shined brightly in the second half of 2019 when the pool of negative-yielding debt around the world began to skyrocket, eventually topping out at around $17 trillion in August.

As of January 2020, it’s estimated that about 30 percent of all investment-grade sovereign government bonds and 15 percent of corporate bonds traded with a negative yield. This means that investors who buy and hold them until maturity are guaranteed to make a loss.
The 30 percent referenced above only includes nominal rates. When adjusted for inflation, some 90 percent of government debt has a negative yield right now, according to WGC estimates.
“And the low rate environment is unlikely to change any time soon,” writes WGC analysts in their “Outlook 2020” report, released January 15. “Many central banks—the highest number since the global financial crisis—are cutting rates, expanding or implementing quantitative (or quasi-quantitative) easing and, in some instances, doing both.”
Lower for Longer
Some economists use the term “Japanification” to describe the process of being permanently stuck in an environment of low inflation and even lower rates, which leaves policymakers with few options to jolt the economy.
Last year, the Federal Reserve, European Central Bank (ECB) and Bank of Japan (BoJ)—which represent a collective 45 percent of world gross domestic product (GDP)—all either cut lending rates or kept them steady at below 0 percent. Japanese officials hinted that they might trim rates further, while President Donald Trump publically pressured Fed Chair Jerome Powell to implement a low-interest policy that’s more in line with other economies.
The U.S. is “one recession away from joining Europe and Japan in the monetary black hole of zero rates and no prospect of escape,” comments Larry Summers, former director of the National Economic Council (NEC).
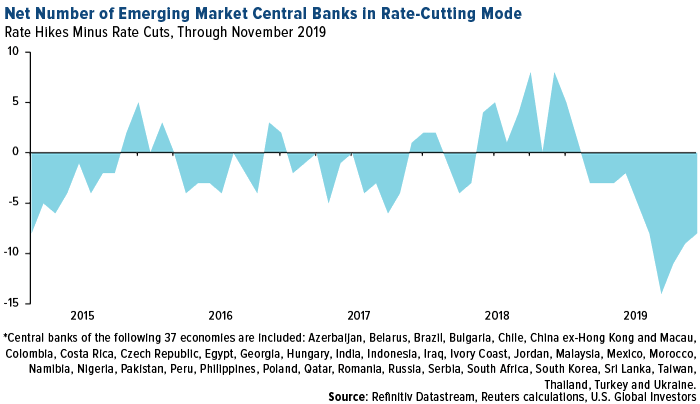
This isn’t a phenomenon seen just in developed economies. Emerging markets are in rate-cutting mode as well. In November, there were as many as eight net rate cuts among a group of 37 developing economies, according to Refinitiv. November, in fact, marked the 10th straight month of net cuts, the longest easing cycle for emerging market central banks since 2013.

Turkey’s is the most recent central bank to lower rates, from 12 percent to 11.25 percent on January 15, pushing its benchmark rate below 0 percent for the first time, when adjusted for inflation.
Interest in Gold as an Investment Has Increased
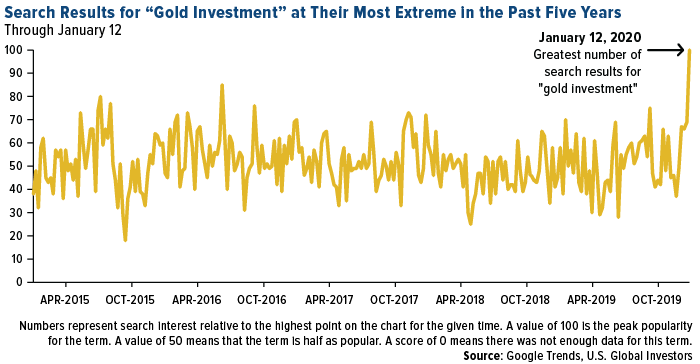
For these reasons and more, interest in gold as an investment has surged, if internet search results are any indication. According to Google Trends data, search queries for the key phrase “gold investment” reached their most extreme level in the past five years. In the chart below, the left axis represents search interest relative to the highest point for the given time period. On January 12, the “gold investment” search term had a reading of 100, indicating that interest in the topic was very recently at its highest point for the five-year timeframe.

So How Can You Participate?
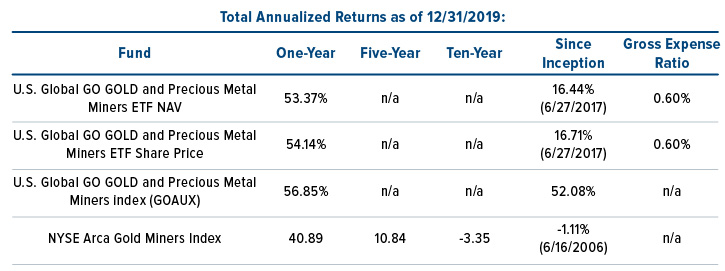
Besides buying physical gold—in bars, coins or jewelry—investors can get exposure through futures contracts or by buying individual gold mining stocks, mutual funds or ETFs. Our favorite strategy to use is the U.S. Global GO GOLD and Precious Metal Miners ETF (GOAU). The ETF, which launched in June 2017, ended the year up a phenomenal 54.2 percent, beating the price of gold bullion (up 18.3 percent) as well as gold mining companies (up 41.6 percent).

GOAU managed to deliver such impressive results because, number one, it’s quant-based and highly selective of the companies it invests in. Unlike many other gold ETFs, which are market cap-weighted, GOAU aims to select only the most profitable, undervalued and high-momentum mining stocks. It’s also rebalanced and reconstituted at the start of every quarter.
What really makes all the difference is that approximately 30 percent of the ETF is invested in the top three royalty and streaming companies—Franco-Nevada, Wheaton Precious Metals and Royal Gold. Fellow streamers Osisko Gold Royalties and Sandstorm Gold represent a further 8 percent of GOAU, as of January.
We believe these firms are the “smart money” of the metals and mining industry. Royalty and streaming companies can help investors manage many common risks associated with traditional producers. Because they’re not directly responsible for building and maintaining mines and other costly infrastructure, huge operating expenses can be avoided. They also hold highly diversified portfolios of mines and other assets, which helps mitigate concentration risk in the event that one of the properties stops producing. As a result, royalty companies have enjoyed a much lower breakeven cost than traditional miners.
To learn more about royalty companies, visit our infographic by clicking here.
Interested in exploring GOAU further? Ask your broker-dealer, or explore the ETF by clicking here.
Past performance does not guarantee future results.

The performance data quoted represents past performance. Past performance does not guarantee future results. The investment return and principal value of an investment will fluctuate so that an investor’s shares, when sold or redeemed, may be worth more or less than their original cost and current performance may be lower or higher than the performance quoted. Short term performance, in particular, is not a good indication of the fund’s future performance, and an investment should not be made based solely on returns. For GOAU performance data current to the most recent month-end please visit www.usglobaletfs.com.
All opinions expressed and data provided are subject to change without notice. Some of these opinions may not be appropriate to every investor.
Market capitalization is the value of the fund as determined by the market price of its issued and outstanding stock
The Bloomberg Barclays Global Aggregate Index is a flagship measure of global investment grade debt from twenty-four local currency markets. This multi-currency benchmark includes treasury, government-related, corporate and securitized fixed-rate bonds from both developed and emerging markets issuers. The NYSE Arca Gold Miners Index is a rules-based index designed to measure the performance of highly capitalized companies in the Gold Mining industry.
